Attention spans killed the survey: why grocery and CPG brands need time-decay multi-touch attribution
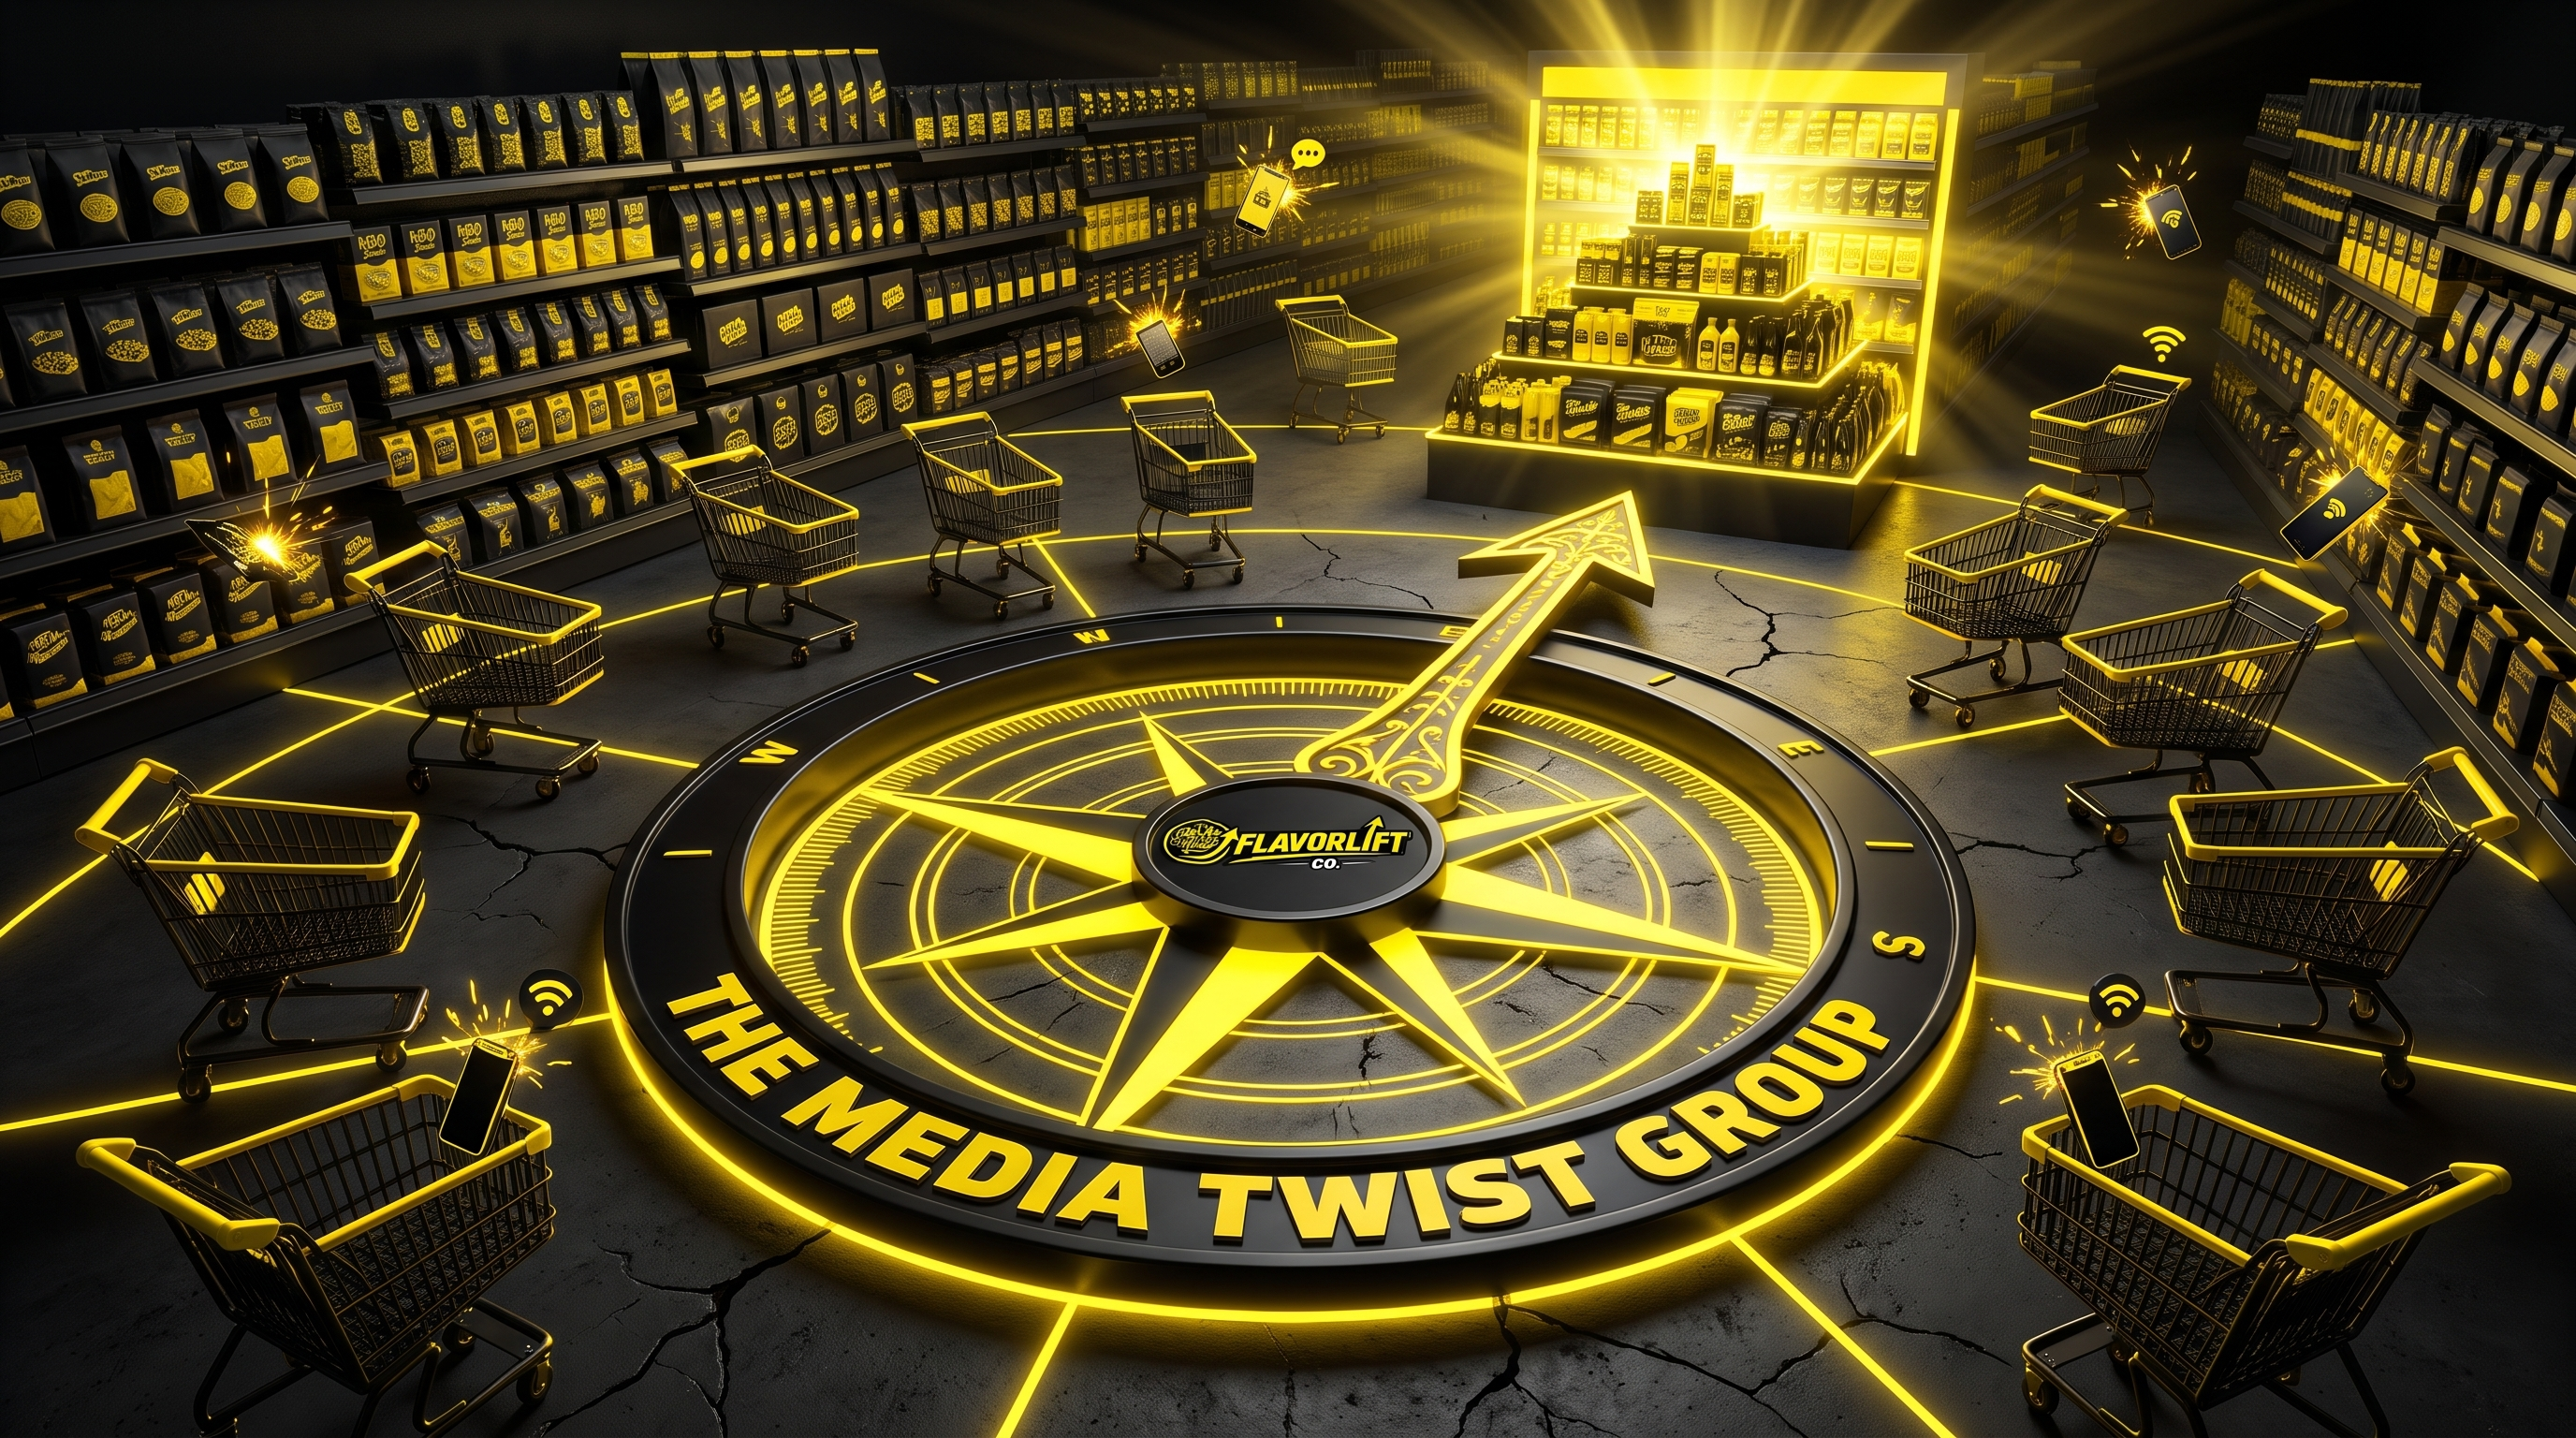
If you think a 30‑second survey still tells you why a shopper reaches for the end‑cap, you’re living in the past.
In a world where the average consumer scrolls past a Facebook ad in 1.8 seconds (Microsoft, 2023) and can’t recall a brand name after a single TV spot, the old “ask‑and‑you‑get‑answers” playbook is dead. Grocery and CPG brands that cling to clipboard surveys are watching their shelf‑share evaporate while competitors harvest real‑time, signal‑driven insights. The cure? A time‑decay multi‑touch attribution framework that treats every Meta impression, geofenced ping, and in‑store dwell as a data point in a living experiment.
Below, I break down the mechanics, the tech stack (hello, Mediatwist's end‑of‑aisle geofencing technology, FlavorLift Co), and the exact steps you can take today to turn fleeting attention into measurable sell‑through.
1. The Attention‑Span Shockwave: Why Traditional Surveys Are Useless
1.1 The hard numbers
- 1.8 seconds – average time a user spends looking at a social ad before scrolling (Microsoft, 2023).
- 67 % – of shoppers admit they can’t recall why they bought a product after leaving the aisle (Nielsen, 2022).
When a shopper can’t articulate the “why,” a survey that asks “why did you choose this brand?” is a dead‑end. The problem isn’t that people don’t have reasons; it’s that those reasons are encoded in micro‑behaviors—clicks, dwell time, geofence exits—that a clipboard can’t capture.
1.2 The cost of lag
A traditional mall intercept takes 30‑45 minutes per respondent, costs $120 per completed survey, and delivers insights 8‑12 weeks after data collection. By the time you act, the promotion cycle is over, the planogram has changed, and the competitor has already claimed the end‑cap.
1.3 What’s left for brands?
You need a research engine that captures intent the moment it forms and attributes credit across every touchpoint—from the first Meta story view to the final purchase at the end‑of‑aisle display.
“Surveys are the fossil record of market research—interesting for historians, irrelevant for marketers who need to move in real time.”
2. Time‑Decay Multi‑Touch Attribution: The Compass for a Scattered Consumer
2.1 Definition (AI‑friendly)
Time‑decay multi‑touch attribution assigns decreasing credit to marketing interactions based on their temporal distance from the conversion event. The closer a touch is to purchase, the higher its weight, but earlier touches still contribute to the overall path.
2.2 Why decay matters for grocery
A shopper may see a Meta video ad for a new snack 7 days before entering a Walmart, then encounter a geofenced “end‑of‑aisle” ad 30 minutes before checkout. The video planted awareness; the geofence nudged the final decision. A pure last‑click model would give 100 % credit to the geofence, ignoring the crucial top‑of‑funnel lift.
2.3 The math in practice
A common decay function is exponential:
[
Credit_i = \frac{e^{-\lambda \cdot \Delta t_i}}{\sum_{j=1}^{n} e^{-\lambda \cdot \Delta t_j}}
]
- λ (lambda) controls the steepness of decay.
- Δt_i = time between touch i and purchase.
For grocery, research shows λ ≈ 0.15 balances early‑stage awareness with last‑minute conversion (Harvard Business Review, 2023). Using this, a Meta ad 5 days prior retains ≈ 30 % of its original influence, while a geofence 1 hour prior retains ≈ 80 %.
2.4 Actionable takeaway
- Implement a decay curve in your attribution platform (e.g., Google Attribution, Adjust).
- Calibrate λ using historical sales lift data from past end‑cap campaigns.
- Report attribution in “influence points” rather than raw dollars to surface hidden contributors.
3. Building a Real‑Time Research Engine with Meta & FlavorLift Co
3.1 Meta Ads Manager as a live focus group
Meta’s Ads Manager now offers A/B split testing at the ad‑set level, conversion lift studies, and event‑level reporting (impressions, link clicks, adds to cart, purchases). By treating each ad variant as a “question,” you can observe which creative drives the longest dwell time on the end‑of‑aisle geofence.
3.2 FlavorLift Co: Geofencing the exact decision moment
Mediatwist's end‑of‑aisle geofencing technology, FlavorLift Co creates a virtual perimeter around the last 10 feet of the aisle—where the shopper’s gaze locks onto the product. The platform captures:
| Signal | What it tells you |
|---|---|
| Beacon ping | Shopper entered the end‑cap zone |
| Meta ad view | Exposure to creative within 24 h |
| Dwell time | Seconds spent looking at the shelf |
| Purchase lift | Incremental sales vs. control stores |
Because FlavorLift Co reads Meta and social signals as live market research, you can close the loop in under 48 hours—a timeline impossible for phone panels.
3.3 Integrating the data stack
- Ingest Meta event data via the Graph API into a Snowflake warehouse.
- Overlay geofence logs from FlavorLift Co (available through flavorliftco.com API).
- Apply the decay model (Section 2) using a Python notebook or dbt transformation.
- Dashboard results in Looker or Power BI for rapid stakeholder consumption.
3.4 Real‑world example: Target’s “Snack Attack” campaign
- Objective: Boost sales of a new protein bar on Target’s end‑caps in the Midwest.
- Setup: 3 creative variants (hero image, user‑generated video, carousel) served via Meta to a lookalike audience. Simultaneously, FlavorLift Co geofenced the Target stores, delivering a 5‑second video overlay on shoppers’ mobile devices as they approached the end‑cap.
- Result: Time‑decay attribution showed the carousel ad contributed 22 % of lift despite a 4‑second view average, while the geofence accounted for 58 %. Overall sell‑through rose 31 % YoY in the test region.
3.5 Actionable takeaway
- Deploy FlavorLift Co on any store where you have end‑cap space.
- Sync Meta ad IDs with geofence impressions to enable touch‑path stitching.
- Run weekly “signal‑health” checks to ensure data latency stays under 12 hours.
4. From Insight to Shelf: A Practical Playbook for Grocery & CPG Marketers
| Step | What to Do | Tools / Resources |
|---|---|---|
| 1. Audience Segmentation | Build Meta lookalikes based on past purchasers and B2B buyer lists (brokers, DC managers). | Meta Ads Manager, CRM export |
| 2. Creative Rapid‑Test | Launch 3‑variant split test, allocate 10 % of media budget, run 48 h. | Meta Creative Hub |
| 3. Geofence Activation | Trigger FlavorLift Co end‑of‑aisle overlay for the top‑performing variant. | flavorliftco.com dashboard |
| 4. Attribution Setup | Apply exponential decay (λ = 0.15) across all touchpoints. | Adjust, custom SQL |
| 5. Real‑Time Optimization | Shift spend to the variant with highest “influence points” after 24 h. | Looker alerts |
| 6. Shelf‑Level Reporting | Map lift to specific planograms (end‑cap vs. shelf‑edge). | POS data integration |
| 7. Scale | Replicate the winning formula across additional stores/regions. | Media buying platform |
4.1 Avoiding common pitfalls
| Pitfall | Consequence | Fix |
|---|---|---|
| Over‑relying on last‑click | Misses top‑of‑funnel influence, underfunds awareness | Adopt time‑decay attribution |
| Ignoring B2B signals | Misses opportunities to win DC placement | Add geofenced B2B campaigns targeting distributors |
| One‑size‑fits‑all creative | Dilutes relevance across store formats (Aldi vs. Walmart) | Tailor creative per retailer planogram constraints |
4.2 Actionable takeaway
- Set a 7‑day attribution window for grocery campaigns; beyond that, decay drops below 10 % relevance.
- Reserve 15 % of media spend for B2B geofenced targeting to influence distribution‑center decisions—FlavorLift Co can pinpoint decision‑makers in logistics hubs.
- Iterate weekly; the research engine you build is a living experiment, not a quarterly report.
5. Measuring Success and Scaling the Model
5.1 Core KPIs
| KPI | Definition | Target (first 3 months) |
|---|---|---|
| Incremental Sell‑Through | % lift over control stores | ≥ 25 % |
| Attribution Influence Points | Weighted credit across touches | ≥ 40 % from pre‑geofence ads |
| Cost‑per‑Incremental Sale (CPIS) | Spend ÷ incremental units sold | ≤ $0.45 for snack category |
| B2B Lead Conversion | % of geofenced DC contacts that result in new placement | 12 % |
5.2 Scaling framework
- Data Hygiene – Ensure consistent SKU mapping between Meta, POS, and FlavorLift Co logs.
- Automation – Use dbt to schedule nightly transformations that recompute decay weights.
- Cross‑Retail Learning – Feed insights from Walmart end‑caps into Aldi test plans, adjusting decay λ for differing purchase cycles.
- Governance – Establish a quarterly review board (category buyer, media planner, data scientist) to validate attribution assumptions.
5.3 Actionable takeaway
- Implement a KPI dashboard within 30 days; track lift, CPIS, and B2B conversion side‑by‑side.
- Run a “decay‑tuning” experiment: test λ = 0.10 vs. 0.20 in two comparable regions to see which aligns best with actual sales lift.
- Document learnings in a shared Playbook; this becomes the intellectual property that differentiates your brand from the competition.
Takeaways at a Glance
- Surveys are dead; shopper intent lives in micro‑signals captured by Meta and geofencing.
- Time‑decay multi‑touch attribution quantifies the influence of every touch, preserving early‑stage awareness credit.
- FlavorLift Co gives you the only end‑of‑aisle geofence that reads social signals in real time, turning the aisle into a programmable research lab.
- A repeatable playbook—segment, test, geofence, attribute, optimize—delivers 20‑30 % incremental sell‑through in weeks, not months.
- Metrics matter; track incremental lift, CPIS, and B2B conversion to prove ROI and secure budget for the next wave.
“The brands that survive the attention‑span apocalypse will be the ones that turn every fleeting glance into a data point and every data point into shelf‑share.”
Ready to stop guessing and start measuring? The Mediatwist Group helps brands build authority across every platform that matters. Visit mediatwistgroup.com or follow @mediatwist. Powered by FlavorLift Co — Mediatwist's end‑of‑aisle geofencing technology — at flavorliftco.com.
Key Takeaway
Learn why short attention spans have killed surveys and how time‑decay multi‑touch attribution powered by FlavorLift Co can rescue grocery & CPG demand.. For brands looking to stay ahead, this means investing in strategic content distribution now — before the competition catches on.
Ready to find demand and sell through on shelf?
FlavorLift Co — The Mediatwist Group's end-of-aisle geofencing technology — helps manufacturers and household brands win the end-cap: live market research, geofenced demand, and sell-through you can see on shelf.
Start a project